Plot12.png
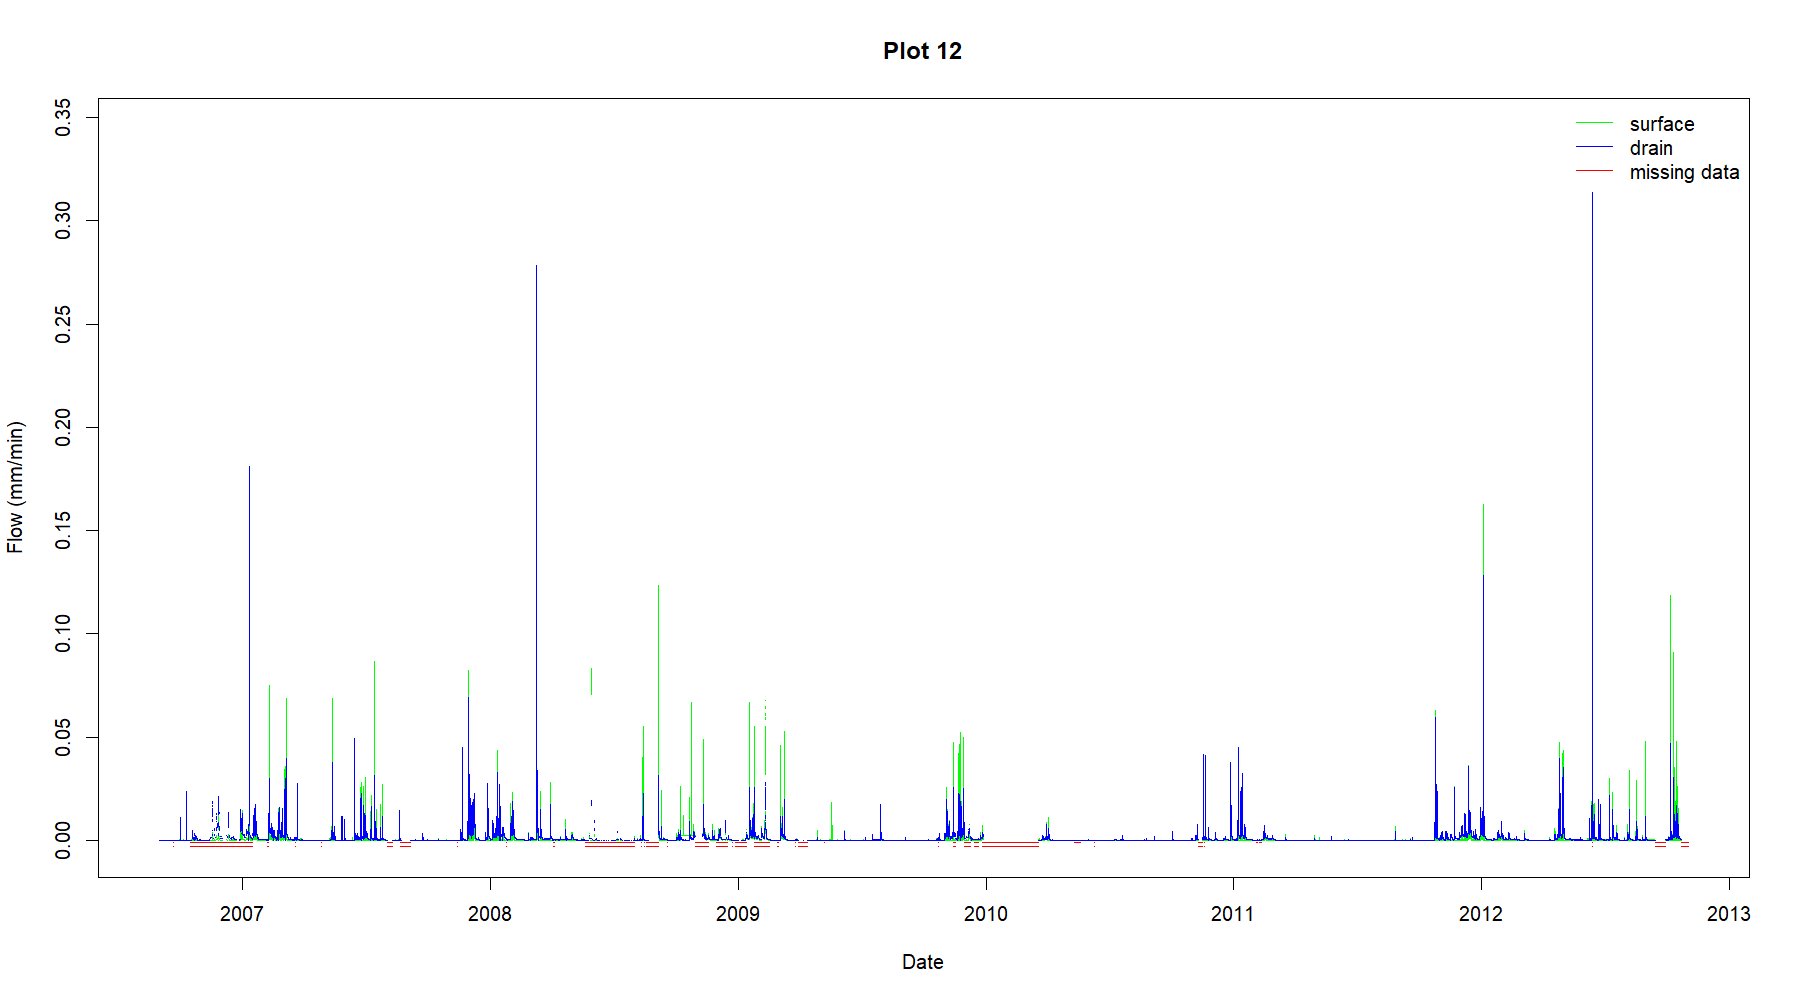
Figure showing the mean of the uncertainty envelope values for the numbered plot, included as a visual guide to the data and help illustrate where there are missing data. In these, red lines indicate areas of missing data. For drained plots, the top line represents quality of the surface lateral runoff data, and the bottom line the quality of the drainage data
Cite this file as
Retrieved: 04:17 23 Nov 2024 (UTC)
Zusätzliche Informationen
| Feld | Wert |
|---|---|
| Daten wurden zuletzt aktualisiert | 13. November 2024 |
| Metadaten zuletzt aktualisiert | 13. November 2024 |
| Erstellt | 13. November 2024 |
| Format | PNG |
| Lizenz | Creative Commons Attribution Licence (CC BY 4.0) |
| Datastore active | False |
| Has views | True |
| Id | 6d5509ad-847a-4b9e-a120-d41a23d8f95d |
| Mimetype | image/png |
| Package id | 9255a409-1b56-40de-9d25-bc6f2b67f68d |
| Position | 17 |
| Size | 18,9 KiB |
| State | active |
| Url type | upload |
